Here's a summary table which provides a 5-day outlook based on the price projections for each GCC index:

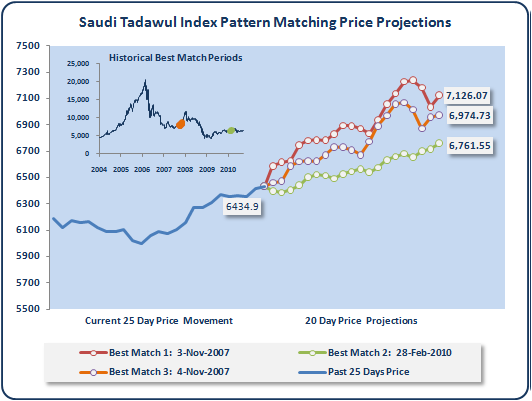
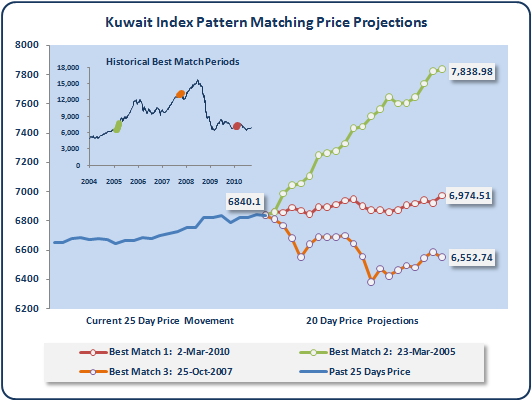
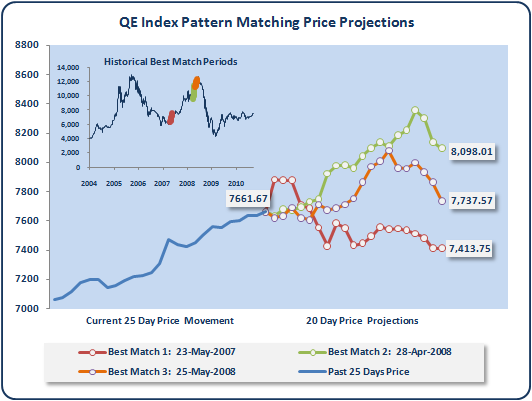
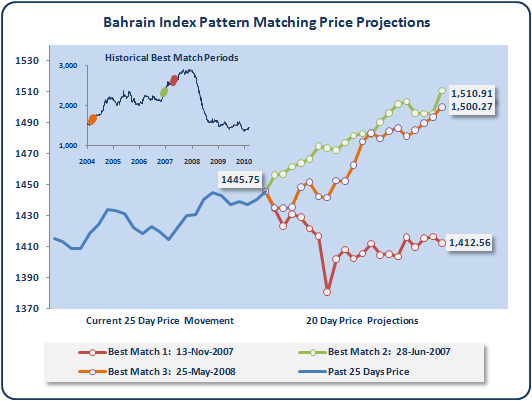
The price projections on the charts below extend for twenty trading days into the future. However, in the table above we're only looking at what the price projections are telling us about the next five days.
For each index there are three 5-day price projections based on the three best historical price matches. For example, the best historical match for the DFM General Index was higher five trading days later (Best Match 1 = "Up"), as was the second best match. However, the thrid best match was lower five trading days later (Best Match 3 = "Down").
The "5-Day Outlook" column provides the average 5-day price change of the three best historical matches. For the DFM General Index the average 5-day outlook is 0.65%.
As you can see, the price projection based outlooks broadly confirm what we're seeing in the other weekly analysis reports (Trend Analysis, Index Analysis & Market Breadth). That is, most projections are pointing to higher index levels this week.
Enjoy.