In this post I want to see if the performance of the 50/200-day crossover strategy can be improved upon by testing a number of other dual moving average strategy combinations on the DFM General Index. But first, a quick recap of dual moving averages and how they're used.
Dual moving averages consist of two moving averages: a short-term moving average and a long-term moving average. The "short-term" and "long-term" descriptors refer to the relative length of the moving averages used. For example, if the short-term moving average length is 30-days then the long-term moving average would have to be greater than 30-days. The "long-term" moving average length must be of greater length than the "short-term" moving average.
Once the moving average lengths have been selected the strategy rules are simple to apply. If the short-term moving average crosses above the long-term moving average a long position is initiated. This long position is maintained whilst the short-term moving average remains above the long-term moving average. If the short-term moving average crosses below the long-term moving average the long position is closed and the strategy moves to cash.
Using these rules I tested many different combinations of the dual moving average strategy on the DFM General Index to determine which had performed best historically. Here's a very scary table showing the results:
 |
| [ Click to enlarge ] |
Fortunately, it's a lot simpler to interpret than it looks. The table consists of many cells. Each cell represents a dual moving average strategy with a specific short-term and long-term moving average combination. Each cell contains the percentage return of corresponding dual moving average strategy (note: returns are uncompounded and do not include fees, commissions, slippage or dividends. Test period is from November 2004 to July 2010).
Along the horizontal axis are the long-term moving averages lengths ranging from 15-days to 200-days. The short-term moving average lengths are on the vertical axis ranging from 10-days to 195-days. To find the return for a particular strategy just locate the intersection of the long-term and short-term moving averages. For example, the 50/200-day moving average crossover strategy discussed in previous posts is located at the intersection of the 200-day long-term moving average and the 50-day short-term moving average (highlighted on the table above).
Additionally, each cell in the table has been colour-coded, dark green to light green, based on the magnitude of the strategy returns. Darker shades of green represent the strategies with the highest returns over the test period. The lightest shades of green represent strategies with the lowest returns.
The colour-coding provides a quick, visual indication of which groupings of dual moving average strategies have provided the best historical returns. For example, below is the same table as above but I've highlighted three broad but distinct strategy groupings which have high returns:
 |
| [ Click to enlarge ] |
The ranges of short and long-term moving average lengths for each of these groupings are as follows:

From each of these three high return groupings I arbitrarily selected the moving average lengths which were in the middle of each range to form three dual moving average strategies. The specific parameters for these dual moving average strategies are as follows:

And the P&L performance for each of these strategies on the DFM General Index are below. For comparison I've also included the 50/200-day crossover strategy and DFM General Index buy and hold strategy. (Note: starting capital = $1000, returns are compounded and do not include fees, commissions, slippage or dividends):
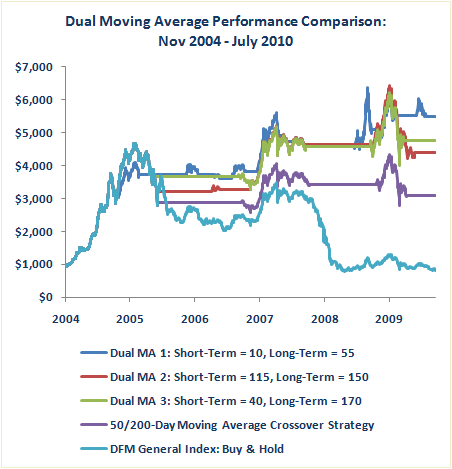
As you can see, all three dual moving average strategies outperform the original 50/200-day crossover strategy and by quite some way. Here are the individual performance statistics for each strategy:

Conclusion
It would have been very surprising if the 50/200-day crossover strategy had turned-out to be the best performing dual moving average strategy for trading the DFM General Index. The three new strategies above demonstrate significantly improved risk-adjusted returns over the 50/200-day crossover strategy with higher returns and lower drawdowns.
A couple of specific points worth commenting on. Firstly, the process of determining the best parameters for a trading strategy is called optimisation. In the above example I tested hundreds of combinations of the dual moving average strategy on the DFM General Index (741 in total) to determine the moving average lengths that generated the highest historical returns. Optimisation is good, it enables a valid trading strategy to be fully exploited. However, it is important that optimisation doesn't lead to what is referred to as curve-fitting. Curve-fitting the parameters of a trading strategy is not good and will most likely result in poor future performance. I'm not going to go into the details of optimisation and curve-fitting here (a topic for a future post). However, when performing an optimisation it is important to ensure the results don't represent curve-fitting. For the record, I think the three dual moving average strategies above are not curve-fit and have a high probability of being profitable int the future (assuming the future price behaviour of the DFM General Index is similar to the historical price behaviour).
Secondly, in order to determine which strategy was the "best" I only considered net returns, with the highest returning strategy being the best. A more robust evaluation would also factor in risk when determine the performance of a trading strategy. In a future post I will rerun this analysis but use a risk/reward measure to judge strategy performance.
I'll also run the dual moving average strategy analysis on other GCC indices and compare the results. Expect a post on this next week.
Enjoy.


