In order to demonstrate the main features of this strategy I'll be applying it to the S&P 500 Index. However, in subsequent posts I will apply the same strategy to the DFM General Index and to other GCC indices.
For those unfamiliar with moving averages just do a google search and you'll find lots of detailed explanations.
In short, however, the strategy comprises two moving averages, one of 50 days and the other of 200 days. The trading rules are simple: if the 50-day moving crosses above the 200-day moving average a long position is initiated. This long position is maintained whilst the 50-day moving average remains above the 200-day moving average. If the 50-day moving average crosses below the 200-day moving average the long position is closed and the strategy moves to cash.

In the example above the 50/200 day moving average crossover strategy applied to the S&P 500 Index. The blue line is the index level, the red line is the 50-day moving average and the green line is the 200-day moving average. As show on the chart, when the 50-day crosses above the 200-day moving average (green arrows) a long position is initiated and this is held until the 50-day falls below the 200-day moving average (red arrows). Simple.
Here's the P&L chart that would have resulted if this strategy had been applied to the S&P 500 Index since 1970 (Note: starting capital = $1,000, profits are reinvested, results do not include fees, slippage or dividends):
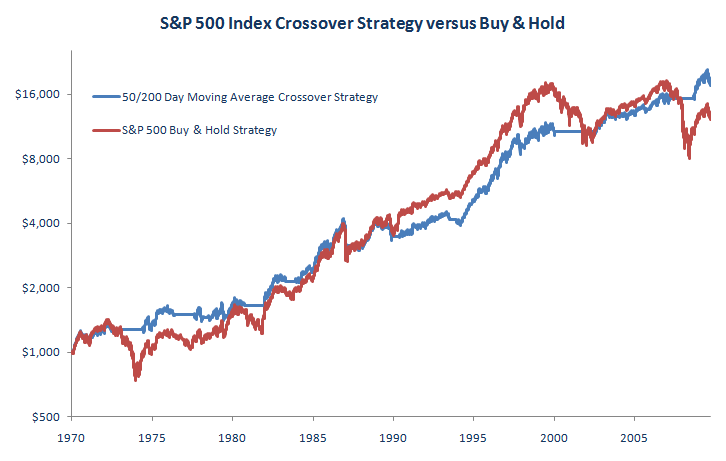

As you can see, over the past 40 years the 50/200 day moving average crossover strategy has more or less generated the same returns as the buy and hold strategy (the annualised return of the crossover strategy was 7.50% versus 6.50% for the buy and hold strategy). However, the advantage of the crossover strategy compared with buy and hold was its ability to avoid the worst of the downturns in the market. For example, the buy and hold strategy experienced a maximum drawdown of nearly -57% whilst the worst drawdown for the crossover strategy was -33%. Similarly, the average drawdown for buy and hold strategy was over 12%, twice as much as the crossover strategy which had an average drawdown of -6%.
Another benefit of the crossover strategy is that it was only invested in the market about 69% of the time versus 100% for the buy and hold strategy. So, the crossover strategy generated similar returns to buy and hold but with significantly less time exposure to the market.
Conclusion
In terms of raw returns the 50/200 day moving average crossover strategy performed similarly to the buy and hold strategy over the test period. However, when drawdowns are considered the crossover strategy performed much better on a risk-adjusted basis than did the buy and hold.
In the post I'll take a look at how 50/200 day moving average crossover strategy has performed on the DFM General Index


